Bradley-Terry models in lmerMultiMember
JP van Paridon
2022-11-10
Source:vignettes/bradleyterry_models.Rmd
bradleyterry_models.RmdOff-label usage of lmerMultiMember
The ability to pass arbitrary random effects matrices to
lme4 makes lmerMultiMember useful for more
than just vanilla multiple membership models. Any model that can be
specified as a combination of “conventional” fixed effects and an
arbitrary random effects matrix can be specified using
lmerMultiMember. (Although for certain model specifications
the underlying lme4 model fitting may not converge.)
One class of models that can be fit using
lmerMultiMember are Bradley-Terry models, used to predict
the probability of a given individual winning in a paired comparison
with another individual, even when information is incomplete (i.e. not
every individual has directly encountered every other individual). One
fairly prominent application is to predict rankings of chess players,
even if not every player in the list has played every other player.
The Bradley-Terry model can be written as a Generalized Linear Mixed-effects Model (GLMM) as follows: \[\operatorname{logit}(P(i > j)) = \log\left(\frac{P(i > j)}{1 - P(i > j)}\right) = \log\left(\frac{P(i > j)}{P(j > i)}\right) = \beta_i - \beta_j\] If you’re not that comfortable with the math, don’t worry! This formulation of the Bradley-Terry model is just a logistic regression with a random effects matrix that has the usual positive indicators for one individual in each comparison, but negative indicators for the other individual. In this formulation we model the probability the the individual with the positive indicator “wins” the comparison. There is often a natural way to assign individuals to sides of the comparison, for instance by always giving the home team the positive indicator (in this case, if we model an intercept, that intercept represents the home field advantage) or, in chess, to always assign the player with the white pieces the positive indicator.
lmerMultiMember::bradleyterry_from_vectors() is a helper
function that creates the indicator matrix from a vector of home teams
(i.e. individuals that will be assigned positive indicators) and a
vector of visiting teams (i.e. individuals that will be assigned
negative indicators). If this function is used to generate the indicator
matrix, we will be modeling the probability of the home team
winning.
Predicting NFL team rankings for the 2021 season
To demonstrate how to specify and fit a Bradley-Terry model in
lmerMultiMember, in this vignette we will rank National
Football League teams by their performance in the 2021 season. Of course
we know who “won” the season, because the Los Angeles Rams won the Super
Bowl at the end of the playoffs. However, with a Bradley-Terry model, we
can predict win probabilities even for teams who did not play a single
game against each other during the season. For example, I might be
wondering how my local team, the Green Bay Packers, would have fared
against my spouse’s home team, the Los Angeles Chargers (formerly of San
Diego), even though these teams are in different conferences and did not
play against each other in 2021 season. As we’ll demonstrate in this
vignette, the coefficients from the Bradley-Terry model can give you a
predicted outcome for this hypothetical game.
NFL scores for the 2021 season are included with
lmerMultiMember as a dataset, so all we need to do to load
the data is load the package itself. Then, we can take a quick look at
the data.
# load packages
library(lmerMultiMember)  # for dataset and modeling
library(kableExtra)  # for displaying tabular data
library(dplyr)  # for data manipulation
library(sjPlot)  # for plotting model coefficients
library(ggplot2)  # for general plotting stuff

# display the NFL 2021 season data
nfl_scores_2021 |>
  kable() |>
  kable_styling(bootstrap_options = c("hover", "condensed"), font_size = 16) |>
scroll_box(height = "250px")| date | season | home_team | visiting_team | home_score | visiting_score | winner |
|---|---|---|---|---|---|---|
| 2021-09-09 | 2021 | TB | DAL | 31 | 29 | home |
| 2021-09-12 | 2021 | WSH | LAC | 16 | 20 | visiting |
| 2021-09-12 | 2021 | ATL | PHI | 6 | 32 | visiting |
| 2021-09-12 | 2021 | BUF | PIT | 16 | 23 | visiting |
| 2021-09-12 | 2021 | CIN | MIN | 27 | 24 | home |
| 2021-09-12 | 2021 | HOU | JAX | 37 | 21 | home |
| 2021-09-12 | 2021 | CAR | NYJ | 19 | 14 | home |
| 2021-09-12 | 2021 | TEN | ARI | 13 | 38 | visiting |
| 2021-09-12 | 2021 | IND | SEA | 16 | 28 | visiting |
| 2021-09-12 | 2021 | DET | SF | 33 | 41 | visiting |
| 2021-09-12 | 2021 | NE | MIA | 16 | 17 | visiting |
| 2021-09-12 | 2021 | NO | GB | 38 | 3 | home |
| 2021-09-12 | 2021 | KC | CLE | 33 | 29 | home |
| 2021-09-12 | 2021 | NYG | DEN | 13 | 27 | visiting |
| 2021-09-12 | 2021 | LAR | CHI | 34 | 14 | home |
| 2021-09-13 | 2021 | OAK | BAL | 33 | 27 | home |
| 2021-09-16 | 2021 | WSH | NYG | 30 | 29 | home |
| 2021-09-19 | 2021 | CLE | HOU | 31 | 21 | home |
| 2021-09-19 | 2021 | PIT | OAK | 17 | 26 | visiting |
| 2021-09-19 | 2021 | CAR | NO | 26 | 7 | home |
| 2021-09-19 | 2021 | NYJ | NE | 6 | 25 | visiting |
| 2021-09-19 | 2021 | PHI | SF | 11 | 17 | visiting |
| 2021-09-19 | 2021 | JAX | DEN | 13 | 23 | visiting |
| 2021-09-19 | 2021 | IND | LAR | 24 | 27 | visiting |
| 2021-09-19 | 2021 | CHI | CIN | 20 | 17 | home |
| 2021-09-19 | 2021 | MIA | BUF | 0 | 35 | visiting |
| 2021-09-19 | 2021 | TB | ATL | 48 | 25 | home |
| 2021-09-19 | 2021 | ARI | MIN | 34 | 33 | home |
| 2021-09-19 | 2021 | SEA | TEN | 30 | 33 | visiting |
| 2021-09-19 | 2021 | LAC | DAL | 17 | 20 | visiting |
| 2021-09-19 | 2021 | BAL | KC | 36 | 35 | home |
| 2021-09-20 | 2021 | GB | DET | 35 | 17 | home |
| 2021-09-23 | 2021 | HOU | CAR | 9 | 24 | visiting |
| 2021-09-26 | 2021 | NYG | ATL | 14 | 17 | visiting |
| 2021-09-26 | 2021 | KC | LAC | 24 | 30 | visiting |
| 2021-09-26 | 2021 | JAX | ARI | 19 | 31 | visiting |
| 2021-09-26 | 2021 | CLE | CHI | 26 | 6 | home |
| 2021-09-26 | 2021 | BUF | WSH | 43 | 21 | home |
| 2021-09-26 | 2021 | PIT | CIN | 10 | 24 | visiting |
| 2021-09-26 | 2021 | DET | BAL | 17 | 19 | visiting |
| 2021-09-26 | 2021 | NE | NO | 13 | 28 | visiting |
| 2021-09-26 | 2021 | TEN | IND | 25 | 16 | home |
| 2021-09-26 | 2021 | DEN | NYJ | 26 | 0 | home |
| 2021-09-26 | 2021 | OAK | MIA | 31 | 28 | home |
| 2021-09-26 | 2021 | LAR | TB | 34 | 24 | home |
| 2021-09-26 | 2021 | MIN | SEA | 30 | 17 | home |
| 2021-09-26 | 2021 | SF | GB | 28 | 30 | visiting |
| 2021-09-27 | 2021 | DAL | PHI | 41 | 21 | home |
| 2021-09-30 | 2021 | CIN | JAX | 24 | 21 | home |
| 2021-10-03 | 2021 | DAL | CAR | 36 | 28 | home |
| 2021-10-03 | 2021 | NYJ | TEN | 27 | 24 | home |
| 2021-10-03 | 2021 | NO | NYG | 21 | 27 | visiting |
| 2021-10-03 | 2021 | BUF | HOU | 40 | 0 | home |
| 2021-10-03 | 2021 | MIA | IND | 17 | 27 | visiting |
| 2021-10-03 | 2021 | PHI | KC | 30 | 42 | visiting |
| 2021-10-03 | 2021 | CHI | DET | 24 | 14 | home |
| 2021-10-03 | 2021 | MIN | CLE | 7 | 14 | visiting |
| 2021-10-03 | 2021 | ATL | WSH | 30 | 34 | visiting |
| 2021-10-03 | 2021 | SF | SEA | 21 | 28 | visiting |
| 2021-10-03 | 2021 | LAR | ARI | 20 | 37 | visiting |
| 2021-10-03 | 2021 | GB | PIT | 27 | 17 | home |
| 2021-10-03 | 2021 | DEN | BAL | 7 | 23 | visiting |
| 2021-10-03 | 2021 | NE | TB | 17 | 19 | visiting |
| 2021-10-04 | 2021 | LAC | OAK | 28 | 14 | home |
| 2021-10-07 | 2021 | SEA | LAR | 17 | 26 | visiting |
| 2021-10-10 | 2021 | ATL | NYJ | 27 | 20 | home |
| 2021-10-10 | 2021 | HOU | NE | 22 | 25 | visiting |
| 2021-10-10 | 2021 | JAX | TEN | 19 | 37 | visiting |
| 2021-10-10 | 2021 | TB | MIA | 45 | 17 | home |
| 2021-10-10 | 2021 | CIN | GB | 22 | 25 | visiting |
| 2021-10-10 | 2021 | PIT | DEN | 27 | 19 | home |
| 2021-10-10 | 2021 | CAR | PHI | 18 | 21 | visiting |
| 2021-10-10 | 2021 | MIN | DET | 19 | 17 | home |
| 2021-10-10 | 2021 | WSH | NO | 22 | 33 | visiting |
| 2021-10-10 | 2021 | LAC | CLE | 47 | 42 | home |
| 2021-10-10 | 2021 | OAK | CHI | 9 | 20 | visiting |
| 2021-10-10 | 2021 | ARI | SF | 17 | 10 | home |
| 2021-10-10 | 2021 | DAL | NYG | 44 | 20 | home |
| 2021-10-10 | 2021 | KC | BUF | 20 | 38 | visiting |
| 2021-10-11 | 2021 | BAL | IND | 31 | 25 | home |
| 2021-10-14 | 2021 | PHI | TB | 22 | 28 | visiting |
| 2021-10-17 | 2021 | JAX | MIA | 23 | 20 | home |
| 2021-10-17 | 2021 | CAR | MIN | 28 | 34 | visiting |
| 2021-10-17 | 2021 | CHI | GB | 14 | 24 | visiting |
| 2021-10-17 | 2021 | WSH | KC | 13 | 31 | visiting |
| 2021-10-17 | 2021 | IND | HOU | 31 | 3 | home |
| 2021-10-17 | 2021 | BAL | LAC | 34 | 6 | home |
| 2021-10-17 | 2021 | NYG | LAR | 11 | 38 | visiting |
| 2021-10-17 | 2021 | DET | CIN | 11 | 34 | visiting |
| 2021-10-17 | 2021 | CLE | ARI | 14 | 37 | visiting |
| 2021-10-17 | 2021 | NE | DAL | 29 | 35 | visiting |
| 2021-10-17 | 2021 | DEN | OAK | 24 | 34 | visiting |
| 2021-10-17 | 2021 | PIT | SEA | 23 | 20 | home |
| 2021-10-18 | 2021 | TEN | BUF | 34 | 31 | home |
| 2021-10-21 | 2021 | CLE | DEN | 17 | 14 | home |
| 2021-10-24 | 2021 | GB | WSH | 24 | 10 | home |
| 2021-10-24 | 2021 | TEN | KC | 27 | 3 | home |
| 2021-10-24 | 2021 | NYG | CAR | 25 | 3 | home |
| 2021-10-24 | 2021 | BAL | CIN | 17 | 41 | visiting |
| 2021-10-24 | 2021 | MIA | ATL | 28 | 30 | visiting |
| 2021-10-24 | 2021 | NE | NYJ | 54 | 13 | home |
| 2021-10-24 | 2021 | OAK | PHI | 33 | 22 | home |
| 2021-10-24 | 2021 | LAR | DET | 28 | 19 | home |
| 2021-10-24 | 2021 | ARI | HOU | 31 | 5 | home |
| 2021-10-24 | 2021 | TB | CHI | 38 | 3 | home |
| 2021-10-24 | 2021 | SF | IND | 18 | 30 | visiting |
| 2021-10-25 | 2021 | SEA | NO | 10 | 13 | visiting |
| 2021-10-28 | 2021 | ARI | GB | 21 | 24 | visiting |
| 2021-10-31 | 2021 | DET | PHI | 6 | 44 | visiting |
| 2021-10-31 | 2021 | CHI | SF | 22 | 33 | visiting |
| 2021-10-31 | 2021 | IND | TEN | 31 | 34 | visiting |
| 2021-10-31 | 2021 | ATL | CAR | 13 | 19 | visiting |
| 2021-10-31 | 2021 | BUF | MIA | 26 | 11 | home |
| 2021-10-31 | 2021 | CLE | PIT | 10 | 15 | visiting |
| 2021-10-31 | 2021 | HOU | LAR | 22 | 38 | visiting |
| 2021-10-31 | 2021 | NYJ | CIN | 34 | 31 | home |
| 2021-10-31 | 2021 | LAC | NE | 24 | 27 | visiting |
| 2021-10-31 | 2021 | SEA | JAX | 31 | 7 | home |
| 2021-10-31 | 2021 | NO | TB | 36 | 27 | home |
| 2021-10-31 | 2021 | DEN | WSH | 17 | 10 | home |
| 2021-10-31 | 2021 | MIN | DAL | 16 | 20 | visiting |
| 2021-11-01 | 2021 | KC | NYG | 20 | 17 | home |
| 2021-11-04 | 2021 | IND | NYJ | 45 | 30 | home |
| 2021-11-07 | 2021 | NYG | OAK | 23 | 16 | home |
| 2021-11-07 | 2021 | CAR | NE | 6 | 24 | visiting |
| 2021-11-07 | 2021 | NO | ATL | 25 | 27 | visiting |
| 2021-11-07 | 2021 | BAL | MIN | 34 | 31 | home |
| 2021-11-07 | 2021 | JAX | BUF | 9 | 6 | home |
| 2021-11-07 | 2021 | MIA | HOU | 17 | 9 | home |
| 2021-11-07 | 2021 | DAL | DEN | 16 | 30 | visiting |
| 2021-11-07 | 2021 | CIN | CLE | 16 | 41 | visiting |
| 2021-11-07 | 2021 | PHI | LAC | 24 | 27 | visiting |
| 2021-11-07 | 2021 | SF | ARI | 17 | 31 | visiting |
| 2021-11-07 | 2021 | KC | GB | 13 | 7 | home |
| 2021-11-07 | 2021 | LAR | TEN | 16 | 28 | visiting |
| 2021-11-08 | 2021 | PIT | CHI | 29 | 27 | home |
| 2021-11-11 | 2021 | MIA | BAL | 22 | 10 | home |
| 2021-11-14 | 2021 | NE | CLE | 45 | 7 | home |
| 2021-11-14 | 2021 | NYJ | BUF | 17 | 45 | visiting |
| 2021-11-14 | 2021 | WSH | TB | 29 | 19 | home |
| 2021-11-14 | 2021 | TEN | NO | 23 | 21 | home |
| 2021-11-14 | 2021 | DAL | ATL | 43 | 3 | home |
| 2021-11-14 | 2021 | PIT | DET | 16 | 16 | visiting |
| 2021-11-14 | 2021 | IND | JAX | 23 | 17 | home |
| 2021-11-14 | 2021 | LAC | MIN | 20 | 27 | visiting |
| 2021-11-14 | 2021 | ARI | CAR | 10 | 34 | visiting |
| 2021-11-14 | 2021 | GB | SEA | 17 | 0 | home |
| 2021-11-14 | 2021 | DEN | PHI | 13 | 30 | visiting |
| 2021-11-14 | 2021 | OAK | KC | 14 | 41 | visiting |
| 2021-11-15 | 2021 | SF | LAR | 31 | 10 | home |
| 2021-11-18 | 2021 | ATL | NE | 0 | 25 | visiting |
| 2021-11-21 | 2021 | NYJ | MIA | 17 | 24 | visiting |
| 2021-11-21 | 2021 | CHI | BAL | 13 | 16 | visiting |
| 2021-11-21 | 2021 | BUF | IND | 15 | 41 | visiting |
| 2021-11-21 | 2021 | PHI | NO | 40 | 29 | home |
| 2021-11-21 | 2021 | JAX | SF | 10 | 30 | visiting |
| 2021-11-21 | 2021 | CLE | DET | 13 | 10 | home |
| 2021-11-21 | 2021 | TEN | HOU | 13 | 22 | visiting |
| 2021-11-21 | 2021 | CAR | WSH | 21 | 27 | visiting |
| 2021-11-21 | 2021 | MIN | GB | 34 | 31 | home |
| 2021-11-21 | 2021 | OAK | CIN | 13 | 32 | visiting |
| 2021-11-21 | 2021 | SEA | ARI | 13 | 23 | visiting |
| 2021-11-21 | 2021 | KC | DAL | 19 | 9 | home |
| 2021-11-21 | 2021 | LAC | PIT | 41 | 37 | home |
| 2021-11-22 | 2021 | TB | NYG | 30 | 10 | home |
| 2021-11-25 | 2021 | DET | CHI | 14 | 16 | visiting |
| 2021-11-25 | 2021 | DAL | OAK | 33 | 36 | visiting |
| 2021-11-25 | 2021 | NO | BUF | 6 | 31 | visiting |
| 2021-11-28 | 2021 | IND | TB | 31 | 38 | visiting |
| 2021-11-28 | 2021 | JAX | ATL | 14 | 21 | visiting |
| 2021-11-28 | 2021 | NYG | PHI | 13 | 7 | home |
| 2021-11-28 | 2021 | NE | TEN | 36 | 13 | home |
| 2021-11-28 | 2021 | HOU | NYJ | 14 | 21 | visiting |
| 2021-11-28 | 2021 | CIN | PIT | 41 | 10 | home |
| 2021-11-28 | 2021 | MIA | CAR | 33 | 10 | home |
| 2021-11-28 | 2021 | DEN | LAC | 28 | 13 | home |
| 2021-11-28 | 2021 | GB | LAR | 36 | 28 | home |
| 2021-11-28 | 2021 | SF | MIN | 34 | 26 | home |
| 2021-11-28 | 2021 | BAL | CLE | 16 | 10 | home |
| 2021-11-29 | 2021 | WSH | SEA | 17 | 15 | home |
| 2021-12-02 | 2021 | NO | DAL | 17 | 27 | visiting |
| 2021-12-05 | 2021 | NYJ | PHI | 18 | 33 | visiting |
| 2021-12-05 | 2021 | CHI | ARI | 22 | 33 | visiting |
| 2021-12-05 | 2021 | DET | MIN | 29 | 27 | home |
| 2021-12-05 | 2021 | MIA | NYG | 20 | 9 | home |
| 2021-12-05 | 2021 | HOU | IND | 0 | 31 | visiting |
| 2021-12-05 | 2021 | CIN | LAC | 22 | 41 | visiting |
| 2021-12-05 | 2021 | ATL | TB | 17 | 30 | visiting |
| 2021-12-05 | 2021 | OAK | WSH | 15 | 17 | visiting |
| 2021-12-05 | 2021 | LAR | JAX | 37 | 7 | home |
| 2021-12-05 | 2021 | SEA | SF | 30 | 23 | home |
| 2021-12-05 | 2021 | PIT | BAL | 20 | 19 | home |
| 2021-12-05 | 2021 | KC | DEN | 22 | 9 | home |
| 2021-12-06 | 2021 | BUF | NE | 10 | 14 | visiting |
| 2021-12-09 | 2021 | MIN | PIT | 36 | 28 | home |
| 2021-12-12 | 2021 | CLE | BAL | 24 | 22 | home |
| 2021-12-12 | 2021 | NYJ | NO | 9 | 30 | visiting |
| 2021-12-12 | 2021 | HOU | SEA | 13 | 33 | visiting |
| 2021-12-12 | 2021 | KC | OAK | 48 | 9 | home |
| 2021-12-12 | 2021 | CAR | ATL | 21 | 29 | visiting |
| 2021-12-12 | 2021 | TEN | JAX | 20 | 0 | home |
| 2021-12-12 | 2021 | WSH | DAL | 20 | 27 | visiting |
| 2021-12-12 | 2021 | LAC | NYG | 37 | 21 | home |
| 2021-12-12 | 2021 | DEN | DET | 38 | 10 | home |
| 2021-12-12 | 2021 | CIN | SF | 23 | 26 | visiting |
| 2021-12-12 | 2021 | TB | BUF | 33 | 27 | home |
| 2021-12-12 | 2021 | GB | CHI | 45 | 30 | home |
| 2021-12-13 | 2021 | ARI | LAR | 23 | 30 | visiting |
| 2021-12-16 | 2021 | LAC | KC | 28 | 34 | visiting |
| 2021-12-18 | 2021 | IND | NE | 27 | 17 | home |
| 2021-12-19 | 2021 | NYG | DAL | 6 | 21 | visiting |
| 2021-12-19 | 2021 | BUF | CAR | 31 | 14 | home |
| 2021-12-19 | 2021 | MIA | NYJ | 31 | 24 | home |
| 2021-12-19 | 2021 | DET | ARI | 30 | 12 | home |
| 2021-12-19 | 2021 | JAX | HOU | 16 | 30 | visiting |
| 2021-12-19 | 2021 | PIT | TEN | 19 | 13 | home |
| 2021-12-19 | 2021 | DEN | CIN | 10 | 15 | visiting |
| 2021-12-19 | 2021 | SF | ATL | 31 | 13 | home |
| 2021-12-19 | 2021 | BAL | GB | 30 | 31 | visiting |
| 2021-12-19 | 2021 | TB | NO | 0 | 9 | visiting |
| 2021-12-20 | 2021 | CLE | OAK | 14 | 16 | visiting |
| 2021-12-20 | 2021 | CHI | MIN | 9 | 17 | visiting |
| 2021-12-21 | 2021 | LAR | SEA | 20 | 10 | home |
| 2021-12-21 | 2021 | PHI | WSH | 27 | 17 | home |
| 2021-12-23 | 2021 | TEN | SF | 20 | 17 | home |
| 2021-12-25 | 2021 | GB | CLE | 24 | 22 | home |
| 2021-12-25 | 2021 | ARI | IND | 16 | 22 | visiting |
| 2021-12-26 | 2021 | CIN | BAL | 41 | 21 | home |
| 2021-12-26 | 2021 | HOU | LAC | 41 | 29 | home |
| 2021-12-26 | 2021 | CAR | TB | 6 | 32 | visiting |
| 2021-12-26 | 2021 | NYJ | JAX | 26 | 21 | home |
| 2021-12-26 | 2021 | ATL | DET | 20 | 16 | home |
| 2021-12-26 | 2021 | NE | BUF | 21 | 33 | visiting |
| 2021-12-26 | 2021 | MIN | LAR | 23 | 30 | visiting |
| 2021-12-26 | 2021 | PHI | NYG | 34 | 10 | home |
| 2021-12-26 | 2021 | SEA | CHI | 24 | 25 | visiting |
| 2021-12-26 | 2021 | OAK | DEN | 17 | 13 | home |
| 2021-12-26 | 2021 | KC | PIT | 36 | 10 | home |
| 2021-12-26 | 2021 | DAL | WSH | 56 | 14 | home |
| 2021-12-27 | 2021 | NO | MIA | 3 | 20 | visiting |
| 2022-01-02 | 2021 | BAL | LAR | 19 | 20 | visiting |
| 2022-01-02 | 2021 | NE | JAX | 50 | 10 | home |
| 2022-01-02 | 2021 | CIN | KC | 34 | 31 | home |
| 2022-01-02 | 2021 | BUF | ATL | 29 | 15 | home |
| 2022-01-02 | 2021 | IND | OAK | 20 | 23 | visiting |
| 2022-01-02 | 2021 | NYJ | TB | 24 | 28 | visiting |
| 2022-01-02 | 2021 | WSH | PHI | 16 | 20 | visiting |
| 2022-01-02 | 2021 | CHI | NYG | 29 | 3 | home |
| 2022-01-02 | 2021 | TEN | MIA | 34 | 3 | home |
| 2022-01-02 | 2021 | LAC | DEN | 34 | 13 | home |
| 2022-01-02 | 2021 | SF | HOU | 23 | 7 | home |
| 2022-01-02 | 2021 | SEA | DET | 51 | 29 | home |
| 2022-01-02 | 2021 | NO | CAR | 18 | 10 | home |
| 2022-01-02 | 2021 | DAL | ARI | 22 | 25 | visiting |
| 2022-01-02 | 2021 | GB | MIN | 37 | 10 | home |
| 2022-01-03 | 2021 | PIT | CLE | 26 | 14 | home |
| 2022-01-08 | 2021 | DEN | KC | 24 | 28 | visiting |
| 2022-01-08 | 2021 | PHI | DAL | 26 | 51 | visiting |
| 2022-01-09 | 2021 | BAL | PIT | 13 | 16 | visiting |
| 2022-01-09 | 2021 | JAX | IND | 26 | 11 | home |
| 2022-01-09 | 2021 | NYG | WSH | 7 | 22 | visiting |
| 2022-01-09 | 2021 | DET | GB | 37 | 30 | home |
| 2022-01-09 | 2021 | MIN | CHI | 31 | 17 | home |
| 2022-01-09 | 2021 | CLE | CIN | 21 | 16 | home |
| 2022-01-09 | 2021 | HOU | TEN | 25 | 28 | visiting |
| 2022-01-09 | 2021 | LAR | SF | 24 | 27 | visiting |
| 2022-01-09 | 2021 | ARI | SEA | 30 | 38 | visiting |
| 2022-01-09 | 2021 | ATL | NO | 20 | 30 | visiting |
| 2022-01-09 | 2021 | TB | CAR | 41 | 17 | home |
| 2022-01-09 | 2021 | BUF | NYJ | 27 | 10 | home |
| 2022-01-09 | 2021 | MIA | NE | 33 | 24 | home |
| 2022-01-09 | 2021 | OAK | LAC | 35 | 32 | home |
| 2022-01-15 | 2021 | CIN | OAK | 26 | 19 | home |
| 2022-01-15 | 2021 | BUF | NE | 47 | 17 | home |
| 2022-01-16 | 2021 | TB | PHI | 31 | 15 | home |
| 2022-01-16 | 2021 | DAL | SF | 17 | 23 | visiting |
| 2022-01-16 | 2021 | KC | PIT | 42 | 21 | home |
| 2022-01-17 | 2021 | LAR | ARI | 34 | 11 | home |
| 2022-01-22 | 2021 | TEN | CIN | 16 | 19 | visiting |
| 2022-01-22 | 2021 | GB | SF | 10 | 13 | visiting |
| 2022-01-23 | 2021 | TB | LAR | 27 | 30 | visiting |
| 2022-01-23 | 2021 | KC | BUF | 42 | 36 | home |
| 2022-01-30 | 2021 | KC | CIN | 24 | 27 | visiting |
| 2022-01-30 | 2021 | LAR | SF | 20 | 17 | home |
| 2022-02-13 | 2021 | CIN | LAR | 20 | 23 | visiting |
Generating a Bradley-Terry indicator matrix and fitting a model
From this dataset we can generate a Bradley-Terry indicator matrix
using lmerMultiMember::bradleyterry_from_vectors().
# generate indicator matrix from home team and visiting team vectors
W <- bradleyterry_from_vectors(nfl_scores_2021$home_team,
                               nfl_scores_2021$visiting_team)

# check dimensions of indicator matrix (should be teams x games)
# i.e. 32 x 285
paste(c("rows/teams:", ", columns/games:"), dim(W)) |> cat()
## rows/teams: 32 , columns/games: 285With the indicator matrix generated, all we need to do is specify a
logistic glmer() model to predict wins by the home team,
and insert our indicator model using a dummy variable.
# convert winners to binary variable for more transparent interpretation
nfl_scores_2021$home_win <- recode(nfl_scores_2021$winner,
                                   "visiting" = 0, "home" = 1)

# fit model
m <- glmer(home_win ~ (1 | indicators),
           family = binomial,
           memberships = list(indicators = W),
           data = nfl_scores_2021)

# show model summary
summary(m)
## Generalized linear mixed model fit by maximum likelihood (Laplace
## Approximation). Model includes multiple membership random effects. [
## glmerModMultiMember]
## Family: binomial ( logit )
## Formula: home_win ~ (1 | indicators)
## Data: nfl_scores_2021
##
## AIC BIC logLik deviance df.resid
## 390.2 397.5 -193.1 386.2 283
##
## Scaled residuals:
## Min 1Q Median 3Q Max
## -1.6333 -0.9093 0.5800 0.8542 1.6139
##
## Random effects:
## Groups Name Variance Std.Dev.
## indicators (Intercept) 0.2554 0.5054
## Number of obs: 285, groups: indicators, 32
##
## Fixed effects:
## Estimate Std. Error z value Pr(>|z|)
## (Intercept) 0.06406 0.12565 0.51 0.61
##
## Group memberships per observation for multiple membership REs:
## Min. per obs. Mean per obs. Max. per obs.
## indicators 0 0 0Sanity check on random intercepts (team strength)
With the model fit, we can start interpreting the coefficients. The intercept of the model represents the home field advantage (i.e. the probability of a home team winning, regardless of that team’s strength). The strength of individual teams is captured in the random intercepts.
# plot random effects
plot_model(m, type = "re", sort.est = TRUE, grid = FALSE,
           line.size = 1.0, dot.size = 3.0) +
  coord_cartesian() +
  theme_bw() +
  ggtitle("Odds ratio of team winning against League-average team") +
  theme(axis.ticks = element_blank(),
        axis.text.x = element_text(size = 12, angle = 60, hjust = 1.0),
        axis.text.y = element_text(size = 12),
        plot.title = element_text(size = 14),
        rect = element_rect(fill = "transparent")) +
  scale_y_continuous() +
  geom_hline(yintercept = 1.0, color = "coral2", size = 1.0) +
  scale_color_manual(values = c("coral3", "coral1"))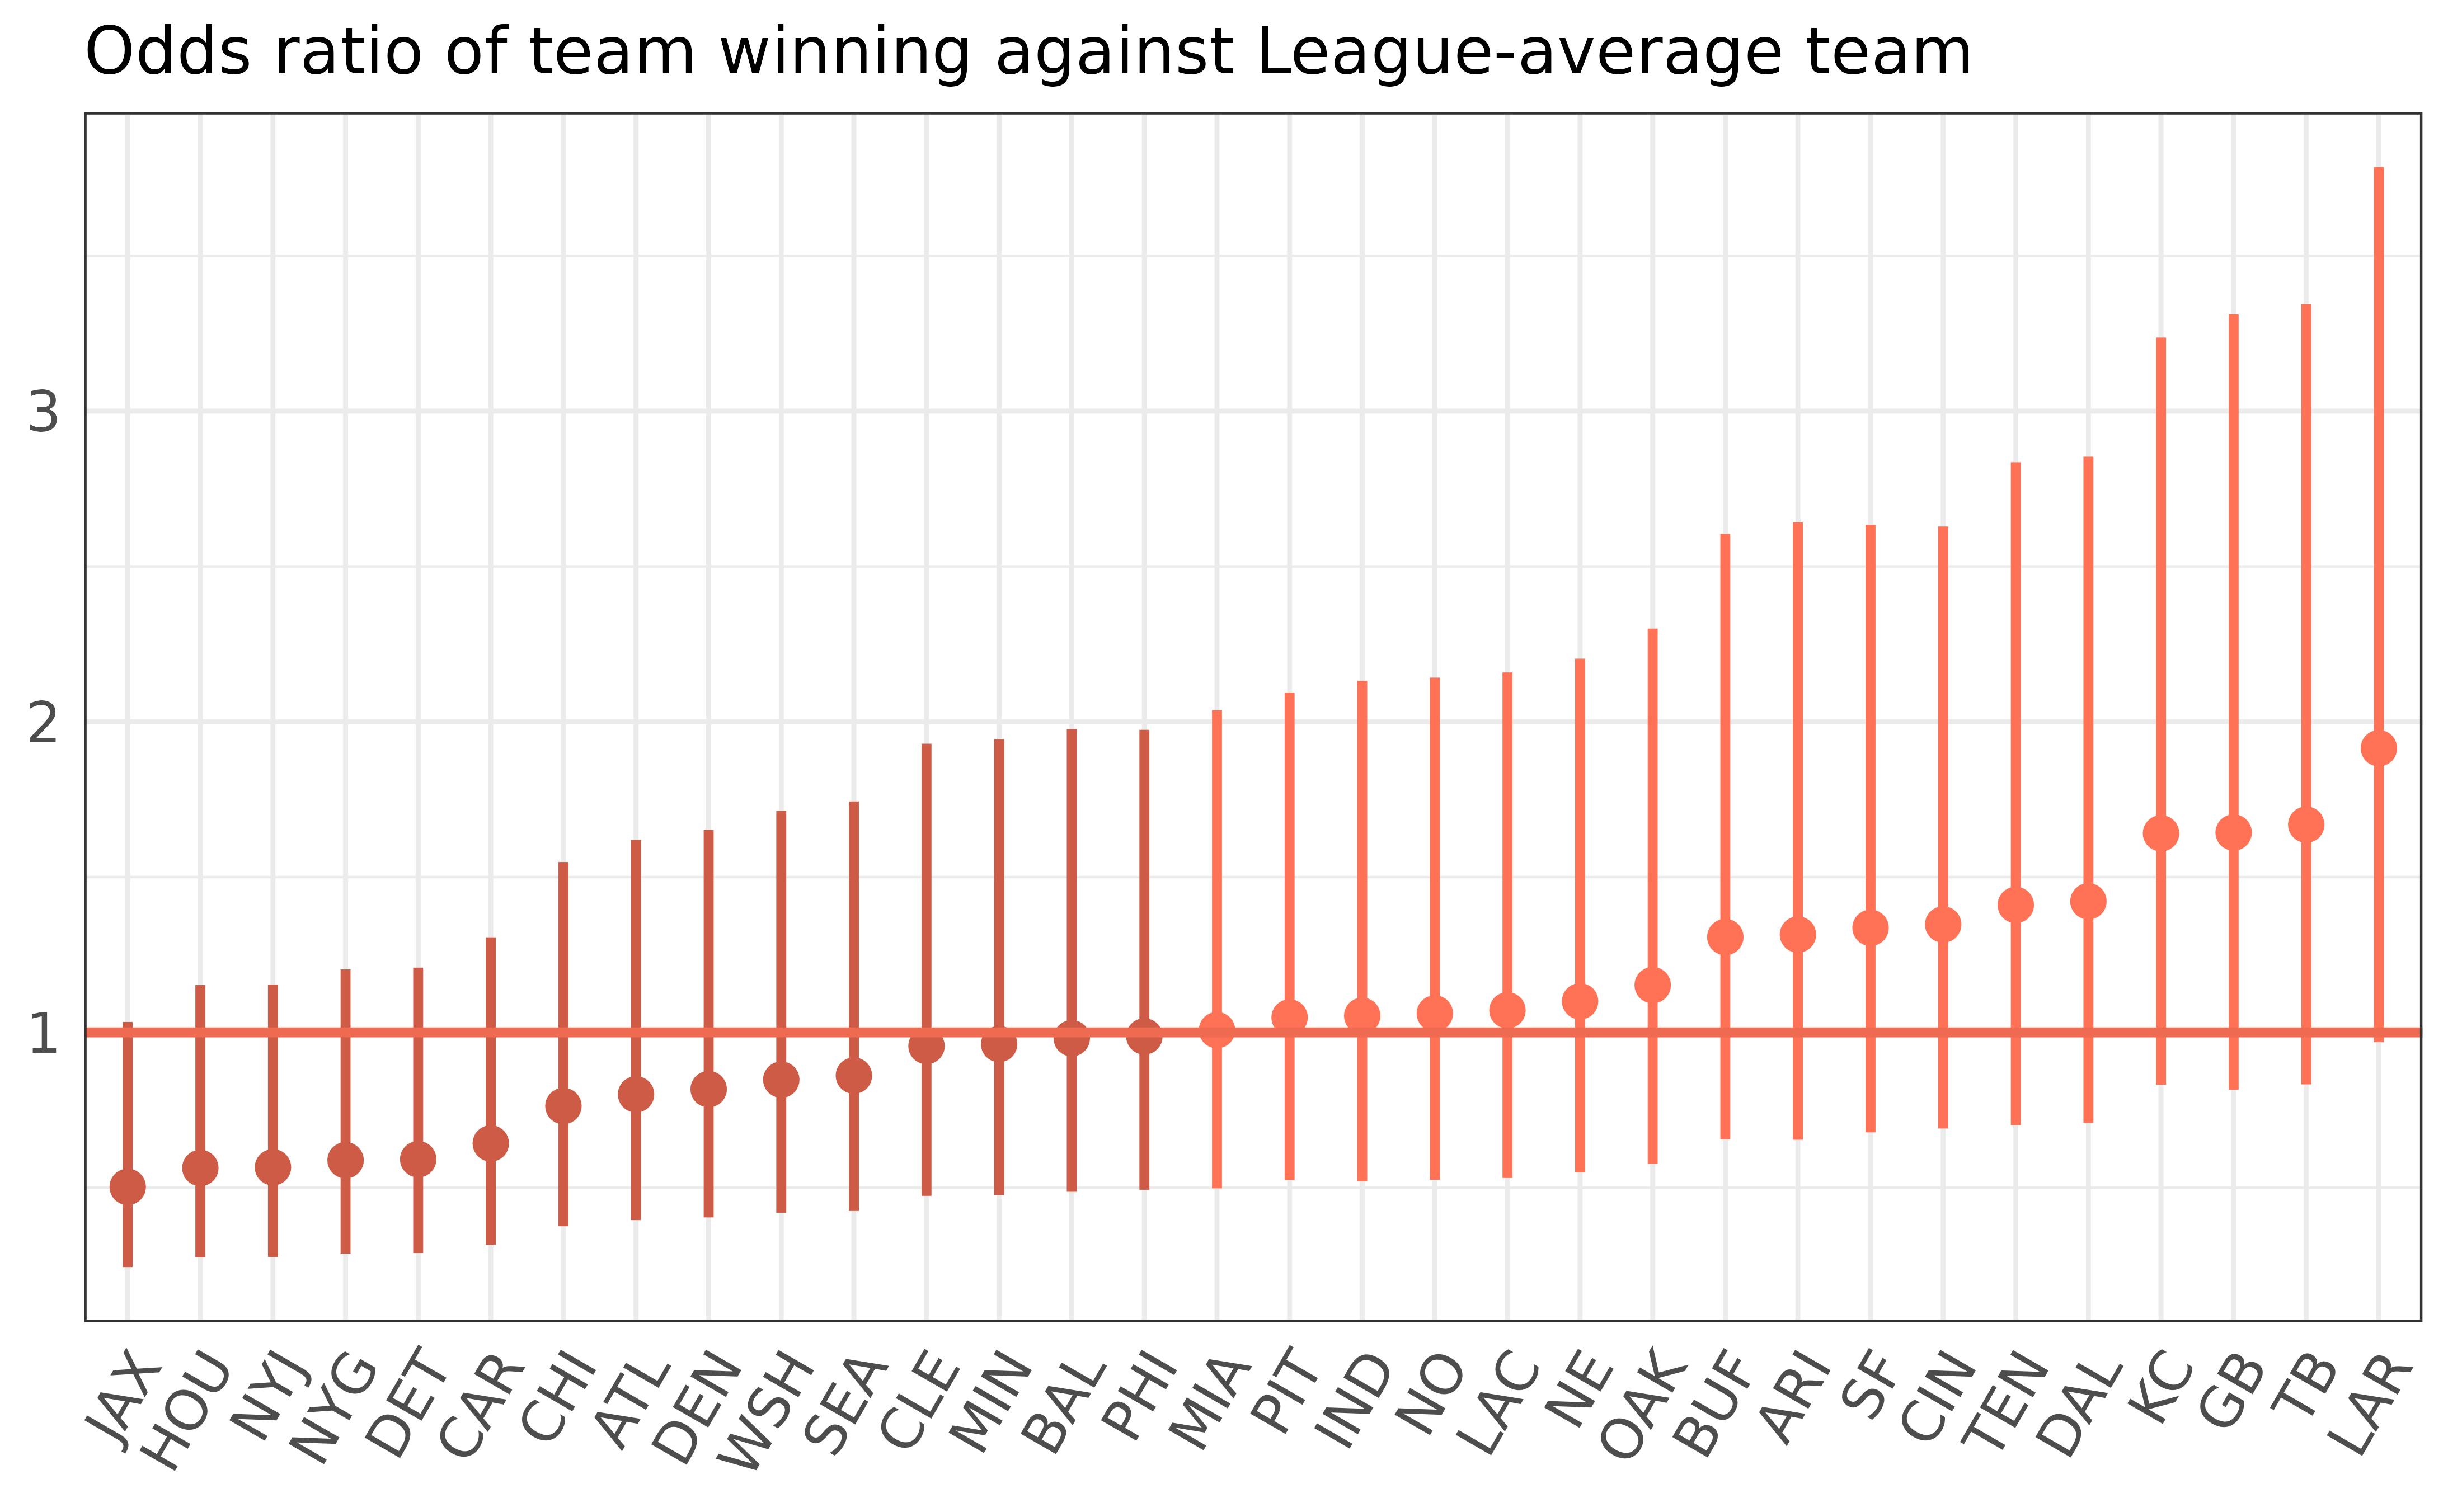
While the model predicts on the scale of logits (log-odds),
sjPlot automatically transforms the coefficients to odds
ratios by exponentiating them. This is a fairly natural way of
interpreting coefficients from a model like this, so let’s take a look
at the best and worst teams.
The Los Angeles Rams, the team with the highest random intercept, has an odds ratio of almost 2, meaning they are favored 2:1 to win against the hypothetical average team in the League. The Rams were the eventual Super Bowl winners in 2021, so this seems like a sensible model prediction, at least superficially.
The Jacksonville Jaguars, the team with the lowest random intercept, has an odds ratio of about .5, meaning their odds of beating the hypothetical League average team are 1:2, which is consistent with their League-worst 3-14 win/loss record.
Predicting the winner of an unplayed game
So far, so good; the model correctly predicted the League’s best and worst teams in the 2021 season. So what about our hypothetical matchup, the LA Chargers playing the Green Bay Packers?
It’s easiest to understand how to make this prediction if we compute it by hand. We start by looking up the random intercepts for the Packers (GB) and Chargers (LAC).
# extract random intercepts for Green Bay and the LA Chargers
ranef(m)$indicators[c("GB", "LAC"), , drop = FALSE] |> round(2)
## (Intercept)
## GB 0.50
## LAC 0.07By exponentiating the difference between these intercepts, we can compute the odds ratio in favor of Green Bay winning this hypothetical matchup.
\[OR(GB > LAC) = \exp(\beta_{GB} - \beta_{LAC}) = \exp(.50 - .07) = 1.54\]
The odds of the 2021 Packers winning against the 2021 Chargers, disregarding any potential home field advantage, are 1.54:1.
Replicating the Bradley-Terry model in Stan
To double-check the predictions we got from
lmerMultiMember, we can fit the same model structure in
Stan, the probabilistic programming language for Bayesian models.
Replicating this model in a Bayesian framework is convenient, because we
can reproduce the mild shrinkage that lme4 applies to its
random effects. (We can approximate the implicit uniform prior on home
field advantage in the lmerMultiMember by putting a very
wide prior on that coefficient in the Stan model.)
We first specify the Stan model’s structure:
data {
  int<lower=1> N;  // number of games
  int<lower=1> M;  // number of teams
  matrix[N, M] W;  // indicator matrix
  int<lower=0> home_win[N];  // outcome
}
parameters {
  real home_adv;  // home field advantage
  vector[M] team_logOR;  // team strength (log odds ratio)
  real<lower=0> sigma;  // sd of team strengths
}
transformed parameters {
  vector[M] team_OR;  // odds ratio per team
  team_OR = exp(team_logOR);  // exponentiate team log OR
}
model {
  home_adv ~ normal(0, 100);  // wide normal prior on home field advantage
  team_logOR ~ normal(0, sigma);  // normal priors on team strength
  home_win ~ bernoulli_logit(home_adv + W * team_logOR);  // likelihood
}
Then, we pass data to the model and sample from it using
rstan. Conveniently, we can use the helper function
lmerMultiMember::bradleyterry_from_vectors() to generate an
indicator matrix for Stan, as well:
# use multiple cores for sampling
options(mc.cores = parallel::detectCores())

# prepare data for passing to Stan sampler
stan_data <- list(
  home_win = nfl_scores_2021$home_win,
  N = nrow(nfl_scores_2021),
  M = length(unique(nfl_scores_2021$home_team)),
  W = t(as.matrix(bradleyterry_from_vectors(nfl_scores_2021$home_team,
                                            nfl_scores_2021$visiting_team)))
)

# sample from Stan model
stan_fit <- rstan::sampling(model_stan, data = stan_data,
                               warmup = 2000, iter = 8000)

# create tidy data frame from posterior samples
stan_post <- broom.mixed::tidy(stan_fit, pars = "team_OR", conf.int = TRUE)

# store fitted Stan model
save(stan_post, file = "bt_model_stan_fit.Rds")
Finally, we can plot the HDIs from the posterior samples in the same
manner that we plotted the lmerMultiMember effects:
# load fitted Stan model (this is to save resources when building vignettes)
load("bt_model_stan_fit.Rds")

# sort teams from low to high and color-code
stan_post$term <- sort(unique(nfl_scores_2021$home_team))
stan_post$color <- cut(stan_post$estimate, breaks = c(0, 1, Inf),
                  labels = c("negative", "positive"))

# plot 95% HDIs
stan_post[order(stan_post$estimate), ] |>
  ggplot(aes(y = estimate, x = factor(term, level = term), color = color)) +
  geom_point(size = 3) +
  geom_linerange(aes(ymin = conf.low, ymax = conf.high,
                     x = factor(term, level = term), color = color), size = 1) +
  theme_bw() +
  ggtitle("Odds ratio of team winning against League-average team") +
  theme(axis.ticks = element_blank(),
        axis.text.x = element_text(size = 12, angle = 60, hjust = 1.0),
        axis.text.y = element_text(size = 12),
        plot.title = element_text(size = 14),
        legend.position = "none",
        rect = element_rect(fill = "transparent")) +
  xlab("") + ylab("") +
  geom_hline(yintercept = 1.0, color = "coral2", size = 1.0) +
  scale_color_manual(values = c("coral3", "coral1"))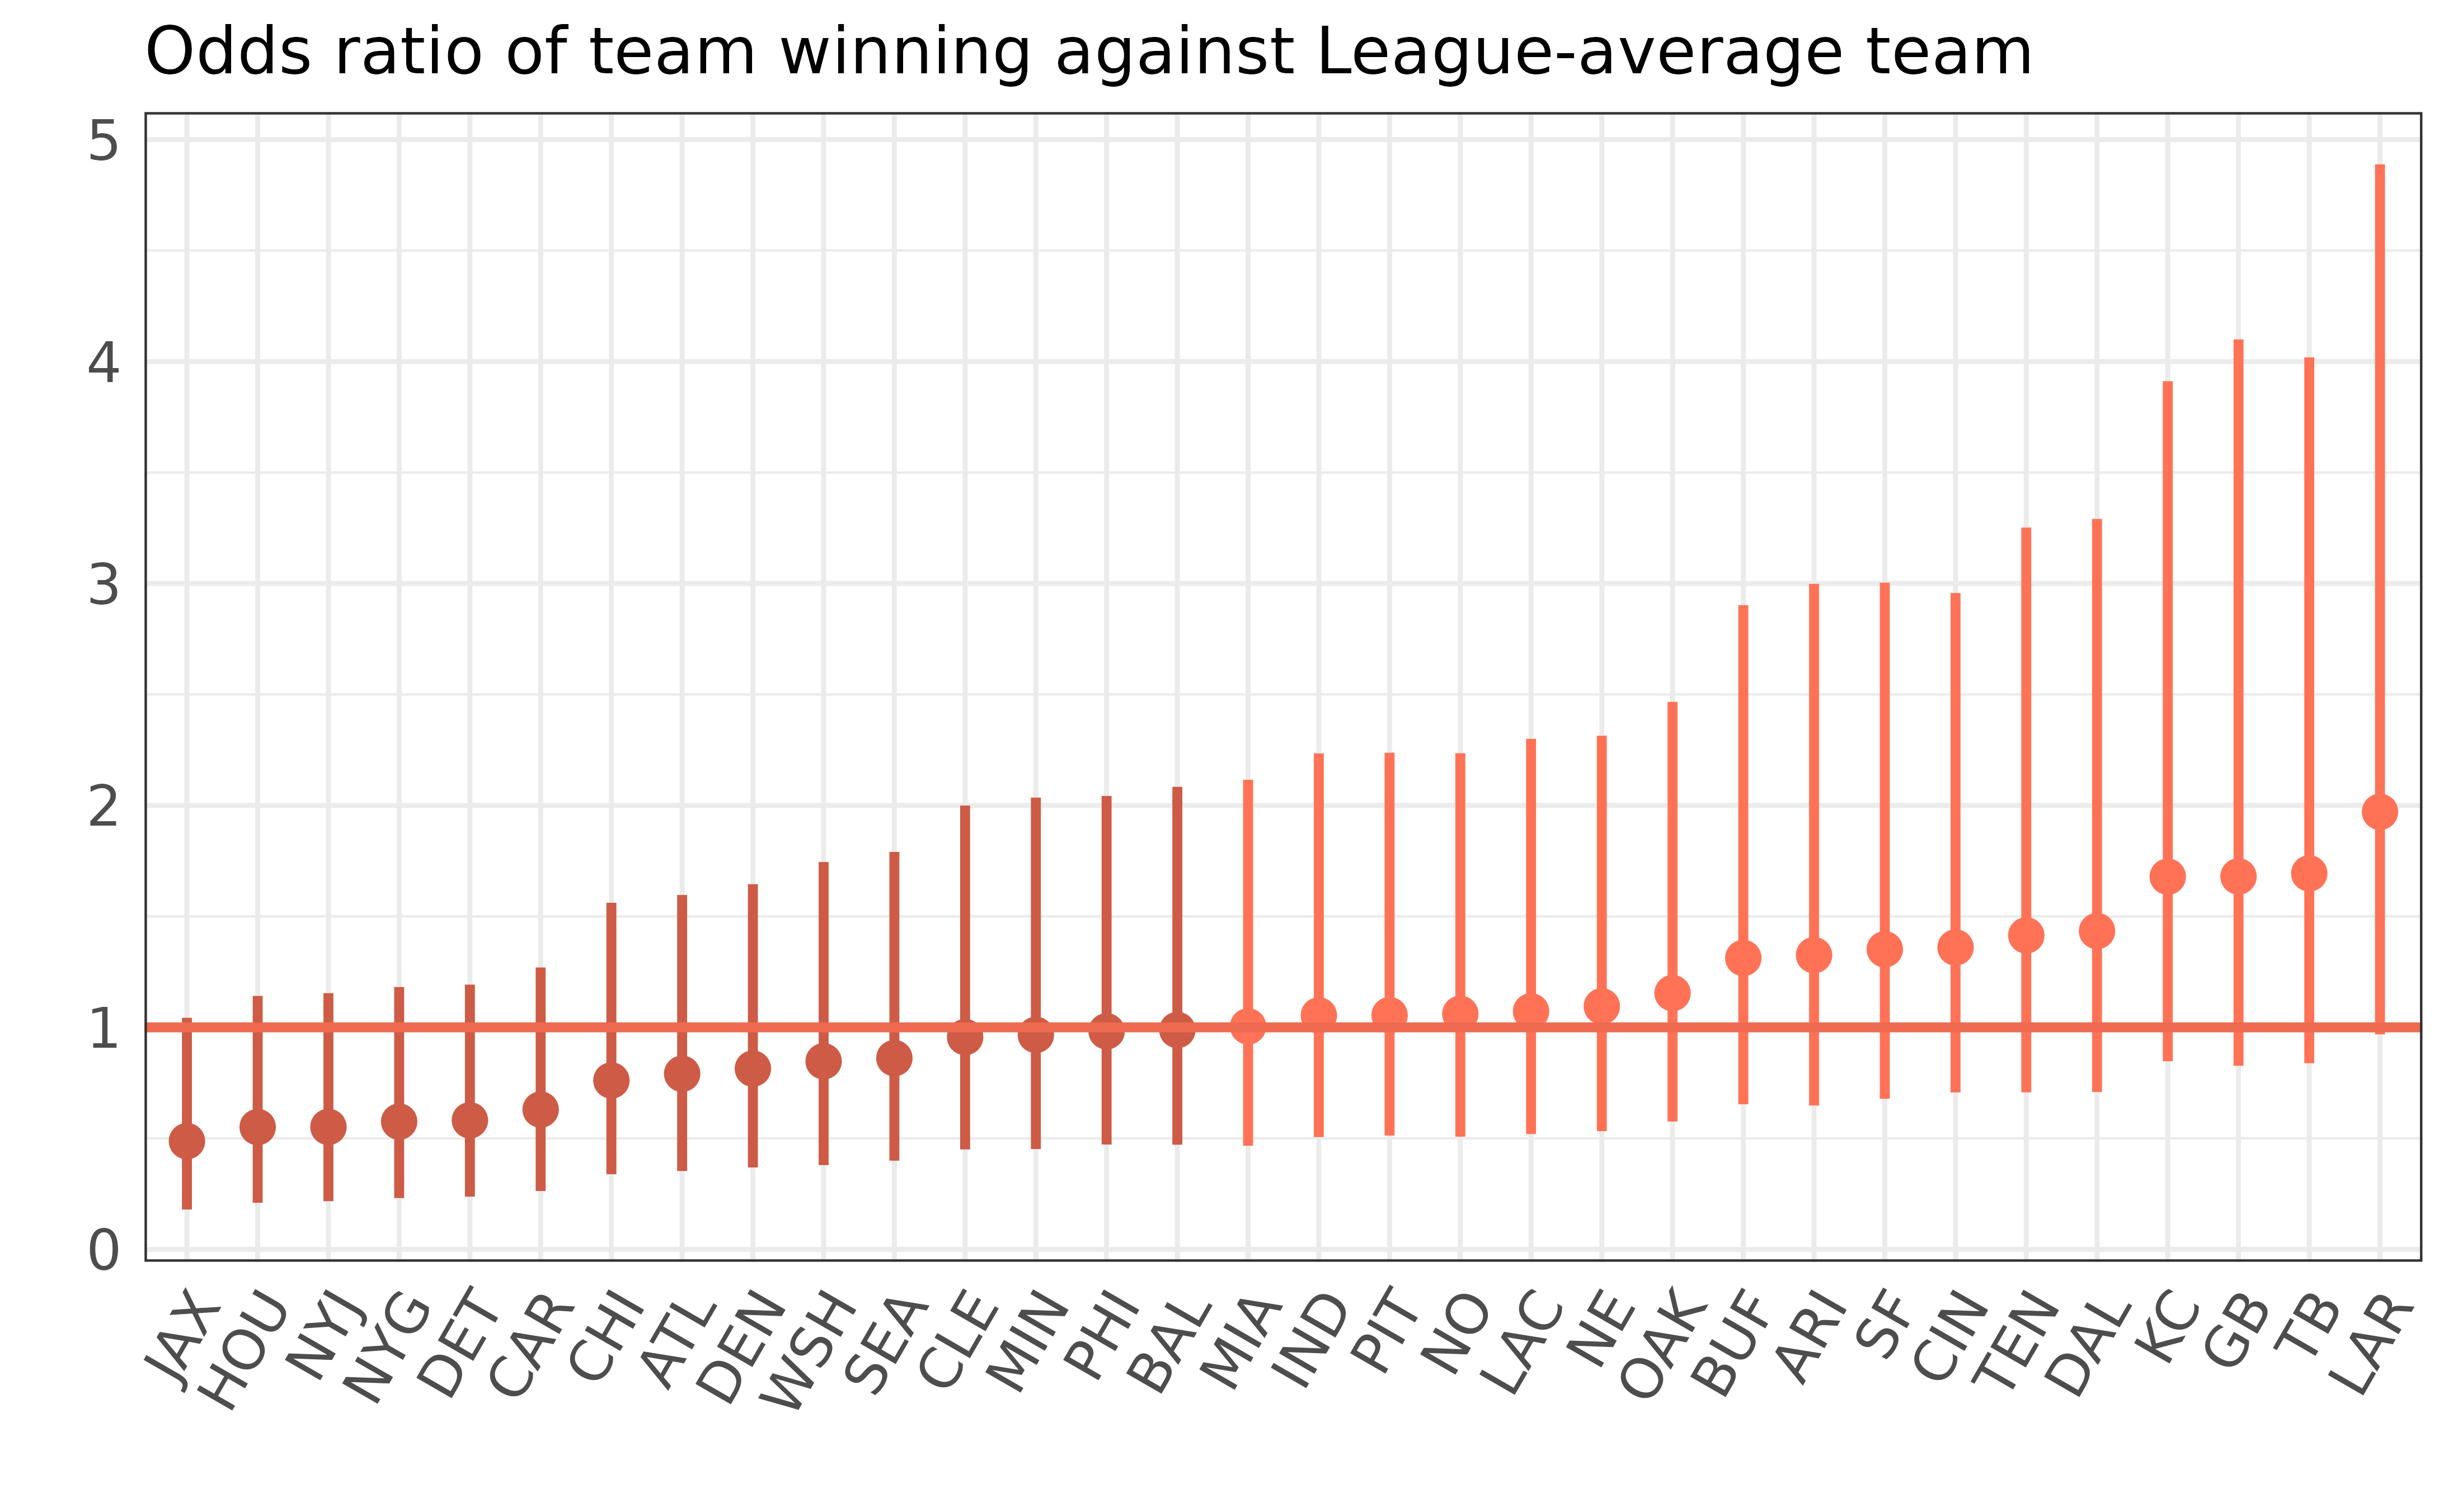
the rstan and lmerMultiMember estimates of
team strength seem to match, although the uncertainty intervals are a
little bit wider here. (This could potentially be fixed by setting
stricter priors.)